1.7.2.2. PitzDaily
1.7.2.2.1. Run Case
[8]:
import IscaOpt
import sys, time
import numpy as np
seed = 1435
np.random.seed(seed)

# import problem classes
import Exeter_CFD_Problems as TestProblems
verbose = False

sys.argv = sys.argv[:1]
print('Demonstration of the PitzDialy test problem.')
# set up directories.
settings = {
    'source_case': 'Exeter_CFD_Problems/data/PitzDaily/case_fine/',
    'case_path': 'Exeter_CFD_Problems/data/PitzDaily/case_single/',
    'boundary_files': ['Exeter_CFD_Problems/data/PitzDaily/boundary.csv'],
    'fixed_points_files': ['Exeter_CFD_Problems/data/PitzDaily/fixed.csv']
}
# instantiate the problem object
prob = TestProblems.PitzDaily(settings)
# get the lower and upper bounds
lb, ub = prob.get_decision_boundary()
# generate random solutions satisfying the lower and upper bounds.
x = np.random.random((1000, lb.shape[0])) * (ub - lb) + lb
rand_x = []
for i in range(x.shape[0]):
    if prob.constraint(x[i]): # check to see if the random solution is valid
        rand_x.append(x[i])
# evaluate for a solution
print('Number of control points: ', prob.n_control)
print('Decision vector: ', rand_x[0])
print('Running simulation ...')
start = time.time()
res = IscaOpt.Optimiser.EMO(prob.evaluate, cfunc=prob.constraint, settings={'n_dim':1,\
                            'n_obj':1,\
                            'method':'EGO', 'lb':lb, 'ub':ub, \
                            'n_samples':109, 'budget':500, \
                            'visualise':True})
print('Objective function value:', res)
print('Time taken:', time.time()-start, ' seconds.')
Demonstration of the PitzDialy test problem.
Number of control points:  [5]
Decision vector:  [ 0.11063283 -0.03252882  0.0333295  -0.02732676  0.07319029  0.00579979
  0.08095974 -0.04046204  0.06019682 -0.02585734]
Running simulation ...
=======================
Simulation settings.
{'visualise': True, 'method': 'EGO', 'ub': array([0.287397, 0.014   , 0.287397, 0.014   , 0.287397, 0.014   ,
       0.287397, 0.014   , 0.287397, 0.014   ]), 'n_obj': 1, 'budget': 500, 'lb': array([-0.01, -0.05, -0.01, -0.05, -0.01, -0.05, -0.01, -0.05, -0.01,
       -0.05]), 'n_dim': 1, 'n_samples': 109}
=======================
<class 'IscaOpt.mono_surrogate.HypI'>   Mat52.       |  value  |  constraints  |  priors
  variance     |    1.0  |      +ve      |
  lengthscale  |    1.0  |      +ve      |
method used:  HypI
Episode:  1
[-0.01 -0.05 -0.01 -0.05 -0.01 -0.05 -0.01 -0.05 -0.01 -0.05] [0.287397 0.014    0.287397 0.014    0.287397 0.014    0.287397 0.014
 0.287397 0.014   ]
Checking for constraints.
adjusted count limit:  411
initial samples:  88
new X
---------------------------------------------------------------------------
KeyboardInterrupt                         Traceback (most recent call last)
<ipython-input-8-28518adc7f46> in <module>()
     33 print('Running simulation ...')
     34 start = time.time()
---> 35 res = IscaOpt.Optimiser.EMO(prob.evaluate, cfunc=prob.constraint, settings={'n_dim':1,                            'n_obj':1,                            'method':'EGO', 'lb':lb, 'ub':ub,                             'n_samples':109, 'budget':500,                             'visualise':True})
     36 print('Objective function value:', res)
     37 print('Time taken:', time.time()-start, ' seconds.')

~/Dropbox/01_thevisualroom/33_machine_learning/optimiserTestProblemSuite/IscaOpt/optimiser.py in EMO(func, fargs, fkwargs, cfunc, cargs, ckwargs, settings)
    213                     print("initial samples: ", xtr.shape[0])
    214             toolbox = mop.get_toolbox(xtr, skwargs, cfunc=cfunc, cargs=cargs, \
--> 215                                         ckwargs=ckwargs)
    216             hpv.append(mop.current_hv)
    217             X = mop.X.copy()

~/Dropbox/01_thevisualroom/33_machine_learning/optimiserTestProblemSuite/IscaOpt/mono_surrogate.py in get_toolbox(self, xtr, skwargs, cfunc, cargs, ckwargs, verbose)
     81         Returns a DEAP toolbox.
     82         """
---> 83         ytr = self.scalarise(xtr, kwargs=skwargs)
     84         self.current_hv = self.current_hpv()
     85         surr = Surrogate(xtr, ytr, self.kernel.copy(), verbose=verbose)

~/Dropbox/01_thevisualroom/33_machine_learning/optimiserTestProblemSuite/IscaOpt/mono_surrogate.py in scalarise(self, x, kwargs)
    142         ref_vector = kwargs.get('ref_vector', None)
    143         approximate_ref = kwargs.get('approximate_ref', False)
--> 144         y = self.m_obj_eval(x)
    145         self.X = x
    146         n_data = x.shape[0]

~/Dropbox/01_thevisualroom/33_machine_learning/optimiserTestProblemSuite/IscaOpt/BO_base.py in m_obj_eval(self, x)
    101             self.X = x.copy() # local copy
    102             # evaluate given objective function
--> 103             y = np.array([self.func(i, *self.args, **self.kwargs) for i in x])
    104             if len(y.shape)<2:
    105                 y = y[:,None]

~/Dropbox/01_thevisualroom/33_machine_learning/optimiserTestProblemSuite/IscaOpt/BO_base.py in <listcomp>(.0)
    101             self.X = x.copy() # local copy
    102             # evaluate given objective function
--> 103             y = np.array([self.func(i, *self.args, **self.kwargs) for i in x])
    104             if len(y.shape)<2:
    105                 y = y[:,None]

~/Dropbox/01_thevisualroom/33_machine_learning/optimiserTestProblemSuite/Exeter_CFD_Problems/pitzdaily.py in evaluate(self, decision_vector, verbose)
     65             raise ValueError('Constraint violated. Please supply a feasible decision vector.')
     66         shape = self.convert_decision_to_shape(decision_vector)
---> 67         return self.run(shape, verbose)
     68
     69 if __name__=='__main__':

~/Dropbox/01_thevisualroom/33_machine_learning/optimiserTestProblemSuite/Exeter_CFD_Problems/pitzdaily.py in run(self, shape, verbose)
     56                     file_name=self.stl_file_name,\
     57                     draw=False)
---> 58         p = self.problem.cost_function(verbose=verbose)
     59         if p == 0:
     60             raise Exception('Pressure difference is exactly zero. This is a bug related to OpenFoam.')

~/Dropbox/01_thevisualroom/33_machine_learning/optimiserTestProblemSuite/Exeter_CFD_Problems/data/SnappyHexOptimise.py in cost_function(self, sense, verbose)
    173             self.stdout = open(os.devnull, 'wb')
    174             with nostdout():
--> 175                 res = self.__cost_function(sense=sense)
    176             return res
    177

~/Dropbox/01_thevisualroom/33_machine_learning/optimiserTestProblemSuite/Exeter_CFD_Problems/data/SnappyHexOptimise.py in __cost_function(self, sense)
    148         """
    149         self.SnappyHexMeshrun()
--> 150         self.Optimisationrun()
    151         if sense=="single":
    152             p = self.RunUtilities()

~/Dropbox/01_thevisualroom/33_machine_learning/optimiserTestProblemSuite/Exeter_CFD_Problems/data/SnappyHexOptimise.py in Optimisationrun(self)
    118         run.start()
    119
--> 120         subprocess.call(['pyFoamCopyLastToFirst.py',self.case_path, self.case_path], stdout=self.stdout)
    121         subprocess.call(['pyFoamClearCase.py', self.case_path], stdout=self.stdout)
    122         subprocess.call(['rm', self.case_path+'0/cellLevel'], stdout=self.stdout)

~/anaconda3/lib/python3.5/subprocess.py in call(timeout, *popenargs, **kwargs)
    247     with Popen(*popenargs, **kwargs) as p:
    248         try:
--> 249             return p.wait(timeout=timeout)
    250         except:
    251             p.kill()

~/anaconda3/lib/python3.5/subprocess.py in wait(self, timeout, endtime)
   1397                         if self.returncode is not None:
   1398                             break  # Another thread waited.
-> 1399                         (pid, sts) = self._try_wait(0)
   1400                         # Check the pid and loop as waitpid has been known to
   1401                         # return 0 even without WNOHANG in odd situations.

~/anaconda3/lib/python3.5/subprocess.py in _try_wait(self, wait_flags)
   1347             """All callers to this function MUST hold self._waitpid_lock."""
   1348             try:
-> 1349                 (pid, sts) = os.waitpid(self.pid, wait_flags)
   1350             except ChildProcessError:
   1351                 # This happens if SIGCLD is set to be ignored or waiting

KeyboardInterrupt:
[ ]:
[2]:
import Exeter_CFD_Problems as TestProblems
[4]:
import sys, time
import numpy as np
seed = 1435
np.random.seed(seed)

# import problem classes
import Exeter_CFD_Problems as TestProblems
verbose = False

sys.argv = sys.argv[:1]
print('Demonstration of the PitzDialy test problem.')
# set up directories.
settings = {
    'source_case': 'Exeter_CFD_Problems/data/PitzDaily/case_fine/',
    'case_path': 'Exeter_CFD_Problems/data/PitzDaily/case_single/',
    'boundary_files': ['Exeter_CFD_Problems/data/PitzDaily/boundary.csv'],
    'fixed_points_files': ['Exeter_CFD_Problems/data/PitzDaily/fixed.csv']
}
# instantiate the problem object
prob = TestProblems.PitzDaily(settings)
Demonstration of the PitzDialy test problem.
[ ]:
prob.run
[2]:
print(max(lb),min(lb))
-0.01 -0.05
[3]:
print(max(ub),min(ub))
0.287397 0.014
[4]:
x
[4]:
array([[ 5.78530692e-02, -3.31068377e-02,  5.50604920e-02, ...,
        -4.71955674e-02,  1.88146599e-01, -1.32952546e-02],
       [-5.67533117e-03, -7.48384848e-03,  1.38897278e-01, ...,
        -3.25892854e-02,  2.22551915e-02, -7.50087530e-03],
       [ 2.71721553e-02, -4.34923342e-02,  2.63459670e-01, ...,
        -1.55789562e-02,  7.12139945e-02, -1.24998786e-02],
       ...,
       [ 2.62482277e-01,  8.32653794e-03,  1.36335014e-01, ...,
        -6.39175269e-03,  1.56653572e-01, -2.76899372e-02],
       [ 2.32482592e-01, -2.66450403e-02,  1.01493483e-01, ...,
        -2.29677976e-02, -8.32203134e-03,  1.86693078e-04],
       [ 2.35917506e-02, -1.43564186e-02, -9.60306583e-03, ...,
        -3.61561063e-02,  2.43942977e-01, -2.07163078e-03]])
1.7.2.2.2. Post Processing
[5]:
! ls
Exeter_CFD_Problems    plotHeatExchanger.py
figures                plotHeatExchangerTemperature.py
HeatExchanger.ipynb    plotKaplanDuct.py
KaplanDuct.ipynb       plotPitzDailyGrid.py
LICENSE                plotPitzDailyStreamlines.py
log                    plotPitzDailyVelocity.py
log2                   PlyParser_FoamFileParser_parsetab.py
log3                   __pycache__
log4                   README.md
PitzDaily.ipynb        sample_script.py
PitzDailyPoints.ipynb  U_centerplane.vtk
[6]:
! postProcess -case Exeter_CFD_Problems/data/PitzDaily/case_single -func sample > log 2>&1
[7]:
# I have run this case from cases_fine to see what the results are for non_optimised case
! postProcess -case Exeter_CFD_Problems/data/PitzDaily/case_non_optimised -func sample > log2 2>&1
[6]:
import warnings; warnings.simplefilter('ignore')
[15]:
%matplotlib inline
[16]:
import numpy as np
import matplotlib
import matplotlib.pyplot as plt
from turbulucid import *

matplotlib.rcParams['figure.figsize'] = (15, 10)
[17]:
matplotlib.rcParams['axes.labelsize'] = 15
matplotlib.rcParams['xtick.labelsize'] = 15
matplotlib.rcParams['ytick.labelsize'] = 15
matplotlib.rcParams['text.usetex'] = True
[8]:
from os.path import join
import turbulucid
import importlib
importlib.reload(turbulucid) # have to reload module if changes are made
case = Case(join("./Exeter_CFD_Problems/data/PitzDaily/", \
                 "case_single","postProcessing","sample", "0", "U_nearWall.vtk"),pointData=True)
[13]:
print(case.fields)
['U']
[14]:
case.xlim[0]
[14]:
-0.025776666930589998
[15]:
case.ylim[0]
[15]:
-0.026246666349433335
[16]:
case.xlim[1]
[16]:
0.29517665818919003
[17]:
max(case.cellCentres[0])
[17]:
0.00020892665
[18]:
case.cellCentres
[18]:
array([[-1.9027714e-02,  2.0892665e-04],
       [-1.9027714e-02,  1.0446333e-04],
       [-2.0072391e-02,  3.1876573e-04],
       ...,
       [ 2.6091382e-01, -1.9279622e-02],
       [ 2.5608581e-01, -1.9622434e-02],
       [ 2.5503725e-01, -1.9715633e-02]], dtype=float32)
[19]:
case['U']
[19]:
array([[ 9.8294477e+00, -8.0274665e-01,  5.5096077e-25],
       [ 6.5214849e+00, -7.0288688e-01,  4.2253022e-25],
       [ 9.9577675e+00, -2.6880601e-01, -3.0189468e-24],
       ...,
       [ 1.3043121e+00,  1.0591840e-01,  0.0000000e+00],
       [ 1.2289770e+00,  7.9705156e-02, -2.8791849e-19],
       [ 1.2289770e+00,  7.9705156e-02, -2.8791849e-19]], dtype=float32)
[20]:
case["magU"] = np.linalg.norm(case["U"], axis=1)
[21]:
case["magU"]
[21]:
array([9.86217213, 6.55925417, 9.96139526, ..., 1.30860567, 1.2315588 ,
       1.2315588 ])
[22]:
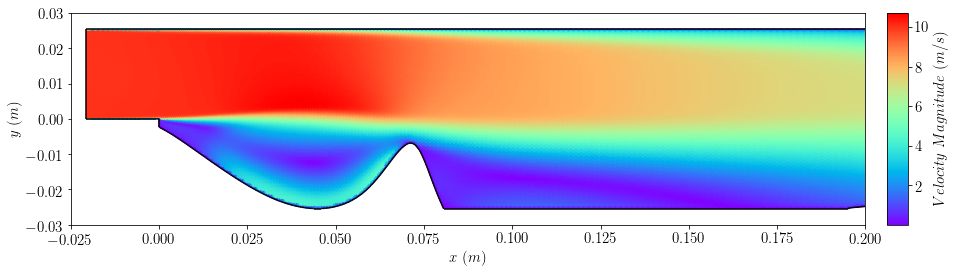
plot=plot_field(case, "magU", cmap='rainbow',colorbar=False)
plt.xlim([-0.025,0.2])
plt.ylim([-0.03,0.03])
plt.xlabel(r'$x \ (m)$')
plt.ylabel(r'$y \ (m)$')
bar=add_colorbar(plot, aspect=10, padFraction=1)
bar.set_label(r'$Velocity \ Magnitude \ (m/s)$')
[23]:
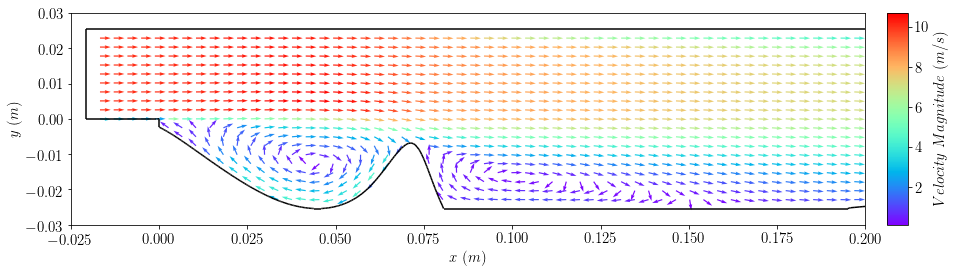
plot2=plot_vectors(case,'U', colorField='magU',cmap='rainbow', normalize=True, \
             sampleByPlane=True,planeResolution=[20, 80], width=0.0015)
plt.xlim([-0.025,0.2])
plt.ylim([-0.03,0.03])
plt.xlabel(r'$x \ (m)$')
plt.ylabel(r'$y \ (m)$')
bar2=add_colorbar(plot2, aspect=10, padFraction=1)
bar2.set_label(r'$Velocity \ Magnitude \ (m/s)$')
[17]:
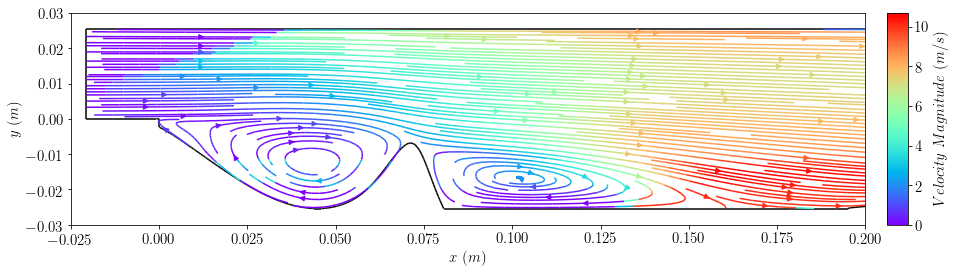
plot3=plot_streamlines(case, 'U',colorField='magU',cmap='rainbow',planeResolution=[100,100],density=2)
plt.xlim([-0.025,0.2])
plt.ylim([-0.03,0.03])
plt.xlabel(r'$x \ (m)$')
plt.ylabel(r'$y \ (m)$')
bar3=add_colorbar(plot3.lines, aspect=10, padFraction=1)
bar3.set_label(r'$Velocity \ Magnitude \ (m/s)$')
[9]:
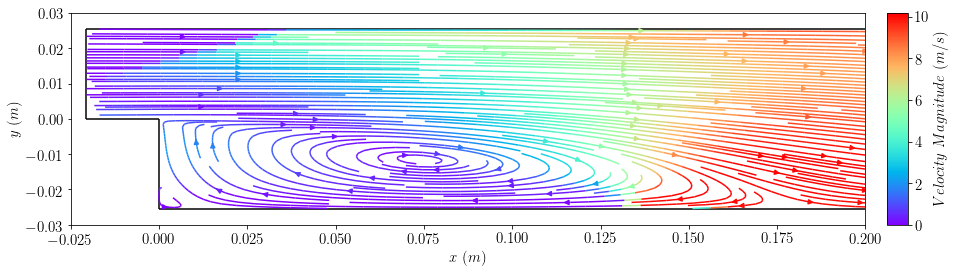
case2 = Case(join("./Exeter_CFD_Problems/data/PitzDaily/", \
                 "case_non_optimised","postProcessing","sample", "1634", "U_nearWall.vtk"),pointData=True)
[37]:
case2["magU"] = np.linalg.norm(case2["U"], axis=1)
[22]:
plot4=plot_streamlines(case2, 'U',colorField='magU',cmap='rainbow',planeResolution=[90,90],density=2)
plt.xlim([-0.025,0.2])
plt.ylim([-0.03,0.03])
plt.xlabel(r'$x \ (m)$')
plt.ylabel(r'$y \ (m)$')
bar4=add_colorbar(plot4.lines, aspect=10, padFraction=1)
bar4.set_label(r'$Velocity \ Magnitude \ (m/s)$')
1.7.2.2.3. Plot Catmull-Clark Curve with Decision Vector, Boundary Points and Fixed Points
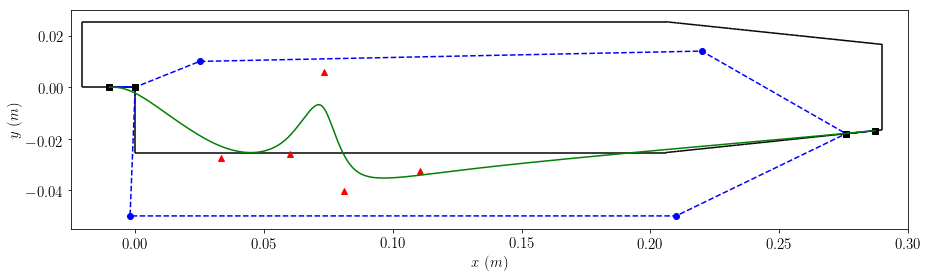
My makeshift way of extracting the decision vector, boundary points and fixed points: * for the decision vector I have extracted the values from rand_x * for the boundary points I have read in the file prob.domain_files * for the fixed points I have read in the file prob.fixed_points_files
Ideally I should have created functions to extract and order and plot these values instead of this, however it does seem to be correct
[11]:
# Partial re-run of the case to access values for plotting
import sys, time
import numpy as np
seed = 1435
np.random.seed(seed)

# import problem classes
import Exeter_CFD_Problems as TestProblems
verbose = False

sys.argv = sys.argv[:1]
print('Demonstration of the PitzDialy test problem.')
# set up directories.
settings = {
    'source_case': 'Exeter_CFD_Problems/data/PitzDaily/case_fine/',
    'case_path': 'Exeter_CFD_Problems/data/PitzDaily/case_single/',
    'boundary_files': ['Exeter_CFD_Problems/data/PitzDaily/boundary.csv'],
    'fixed_points_files': ['Exeter_CFD_Problems/data/PitzDaily/fixed.csv']
}
# instantiate the problem object
prob = TestProblems.PitzDaily(settings)
# get the lower and upper bounds
lb, ub = prob.get_decision_boundary()
# generate random solutions satisfying the lower and upper bounds.
x = np.random.random((1000, lb.shape[0])) * (ub - lb) + lb
rand_x = []
for i in range(x.shape[0]):
    if prob.constraint(x[i]): # check to see if the random solution is valid
        rand_x.append(x[i])
Demonstration of the PitzDialy test problem.
[29]:
boundaries=plot_boundaries(case2)
plt.xlim([-0.025,0.3])
plt.ylim([-0.055,0.03])
plt.xlabel(r'$x \ (m)$')
plt.ylabel(r'$y \ (m)$')

# decision vector
for i in range(0,10,2):
    plt.plot(rand_x[0][i],rand_x[0][i+1], 'r^')

# boundary points
pts = [np.loadtxt(filename, delimiter=',') for filename in prob.domain_files]

x_boundary = []
y_boundary = []

for i in range(0,11,1):
    x_boundary.append(pts[0][i][0])
    y_boundary.append(pts[0][i][1])

plt.plot(x_boundary,y_boundary,'bo--')

#fixed_points
fixed_points = [list(np.loadtxt(filename, delimiter=',').astype(int))\
                            for filename in prob.fixed_points_files]

fixed=[fixed_points[0][0][0],fixed_points[0][0][1],fixed_points[0][1][0],fixed_points[0][1][1]]

x_fixed = []
y_fixed = []

for j in fixed:
    x_fixed.append(pts[0][j][0])
    y_fixed.append(pts[0][j][1])

plt.plot(x_fixed,y_fixed,'ks')

x_curve = []
y_curve = []

#catmull_clark curve
shape=prob.convert_decision_to_shape(rand_x[0]) # convert random array to ordered list
for control_points in shape:
    data_points = TestProblems.data.support.catmull(control_points)
    for i in range(prob.niter):
        data_points = TestProblems.data.support.catmull(data_points)

for k in range(0,512):
    x_curve.append(data_points[k][0])
    y_curve.append(data_points[k][1])

plt.plot(x_curve,y_curve,'g-')
[29]:
[<matplotlib.lines.Line2D at 0x7fe2bc679be0>]
[27]:
len(pts[0])
[27]:
11
[22]:
pts #these are the boundary points [x, y] there are 11 of them
[22]:
[array([[-0.01     ,  0.       ],
        [ 0.       ,  0.       ],
        [ 0.025    ,  0.01     ],
        [ 0.22     ,  0.014    ],
        [ 0.276    , -0.0180675],
        [ 0.287397 , -0.0168678],
        [ 0.276    , -0.0180666],
        [ 0.21     , -0.05     ],
        [-0.002    , -0.05     ],
        [ 0.       ,  0.       ],
        [-0.01     ,  0.       ]])]
[23]:
fixed_points # these are the fixed points, the first two points, and points 4 and 5. They are grouped like
             # this to control the gradient at these points
[23]:
[[array([0, 1]), array([4, 5])]]
Question: why are there only four fixed points, when there should be seven, because points 6, 9 and 10 are also fixed? Is this something to do with the gradient being controlled only by [0,1] and [4,5]? Or are they arbitarily chosen to be the ends of the polynomial only? i.e. I could have fixed [5,6] and [9,10] instead of [0,1] and [4,5]
1.7.2.2.4. Triangulated Grids
[52]:
import plotPitzDailyGrid
import importlib
importlib.reload(plotPitzDailyGrid) # have to reload module if changes are made
%matplotlib inline
[53]:
! foamToVTK -case Exeter_CFD_Problems/data/PitzDaily/case_non_optimised > log3 2>&1
grid = \
'Exeter_CFD_Problems/data/PitzDaily/case_non_optimised/VTK/case_non_optimised_1634.vtk'
plotPitzDailyGrid.plot(grid)
[54]:
! foamToVTK -case Exeter_CFD_Problems/data/PitzDaily/case_single > log4 2>&1
grid_2 = \
'Exeter_CFD_Problems/data/PitzDaily/case_single/VTK/case_single_0.vtk'
plotPitzDailyGrid.plot(grid_2)
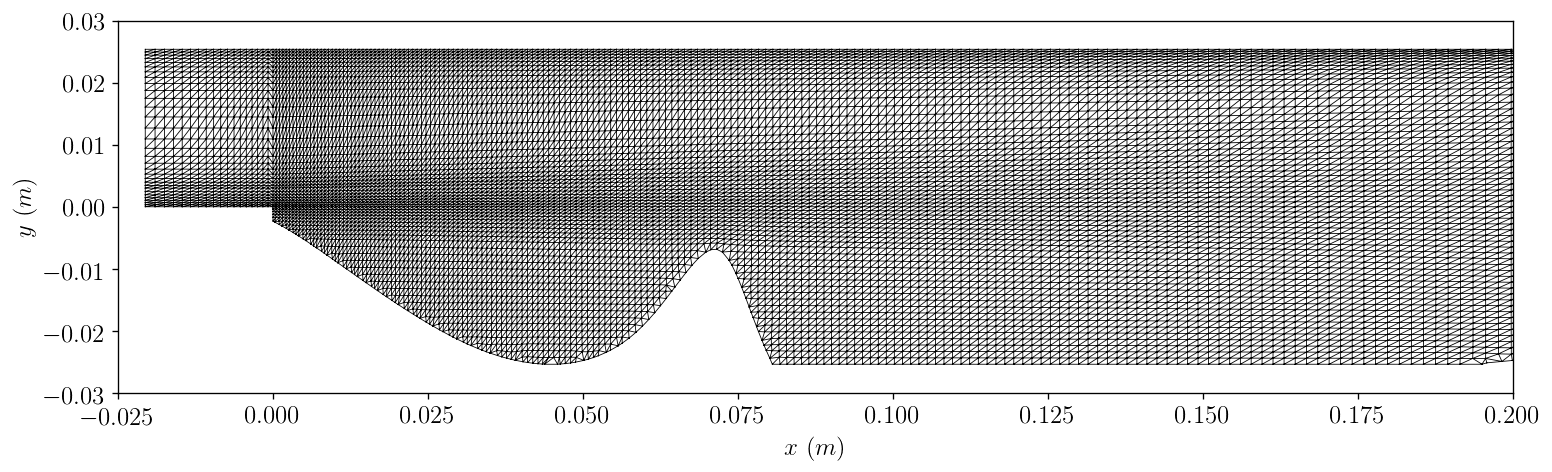
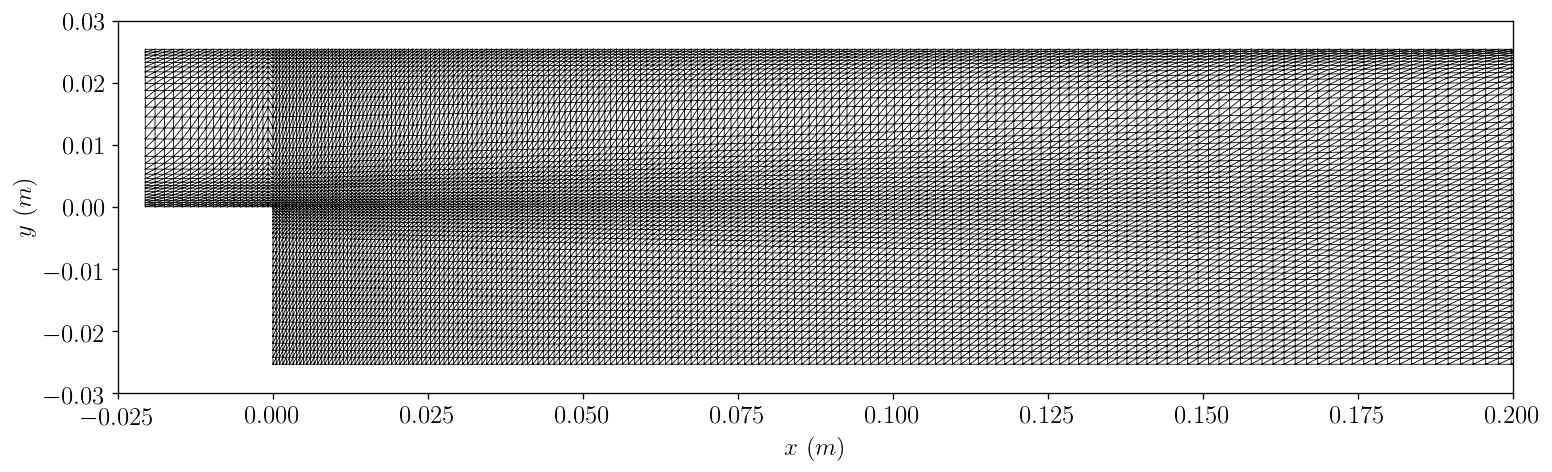
Question: Why is some of the Catmull-Clark polynomial ignored if y < -0.025m, even though it is within the permitted boundary?
[ ]: